Bank has been actively engaged in lending operations, providing financial support to diverse borrowers. To ensure the sustainability and profitability of our loan portfolio, it is imperative to delve deeper into the data generated by our lending activities. The existing Bank Loan Analysis project aims to monitor key performance indicators (KPIs) and visualize trends, but there is a need to address specific business challenges to optimize our lending operations further. The existing analysis lacks granularity in identifying growth opportunities by region, refining risk management for ‘Healthy Loans,’ tailoring loan terms to borrower preferences, understanding specific loan purposes, and achieving a holistic customer profile. Addressing these issues is crucial for enhancing our competitive edge, reducing risk exposure, and fostering sustained growth in our loan portfolio.
Business Objective:
Optimize Lending Strategies by strategically expanding into high-potential regions, implementing advanced risk mitigation techniques to minimize non-performing loans, tailoring loan products to meet diverse customer needs, understanding the underlying motivations behind loan applications, and developing a unified customer profile. These objectives aim to position our bank as an agile and customer-focused industry leader, ensuring long-term success and profitability in the competitive lending landscape.
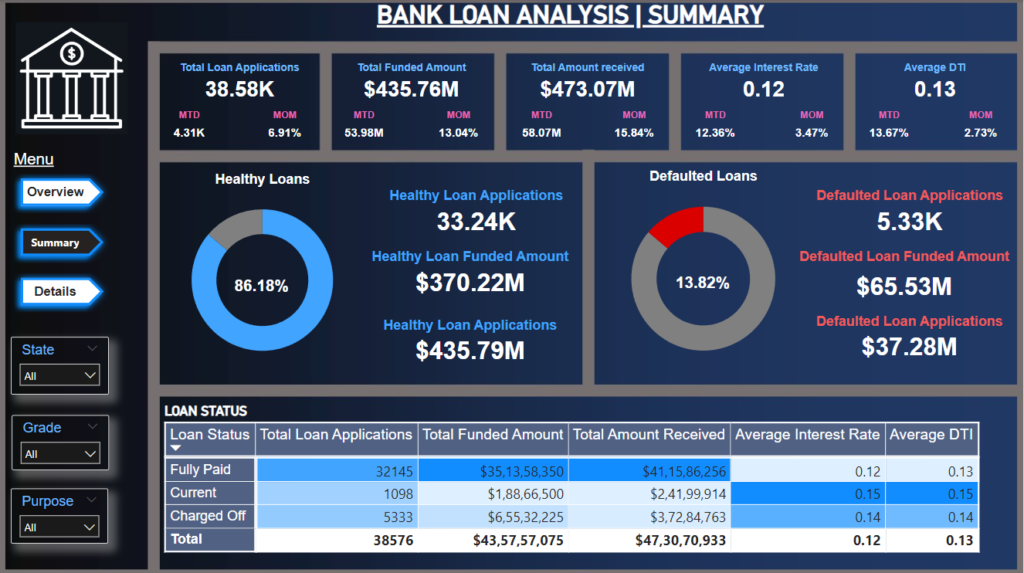
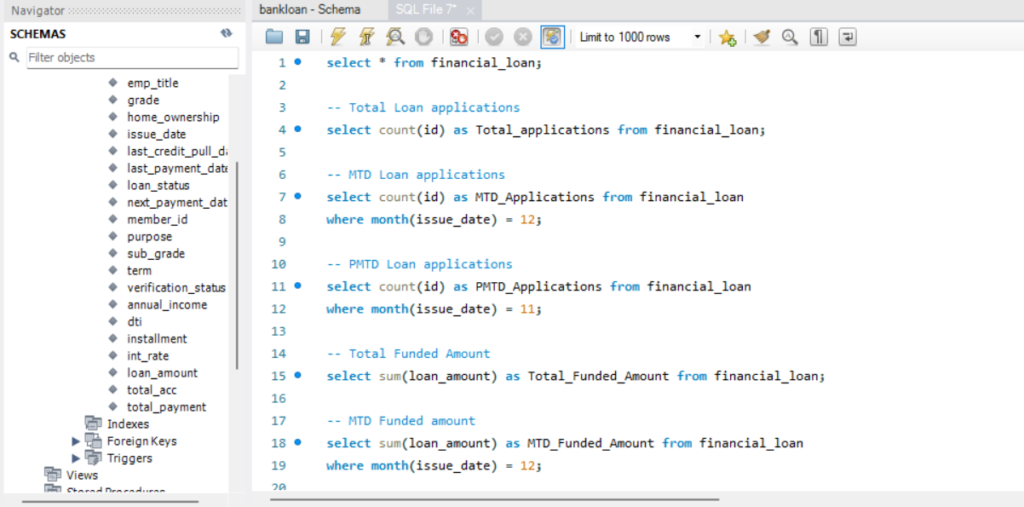
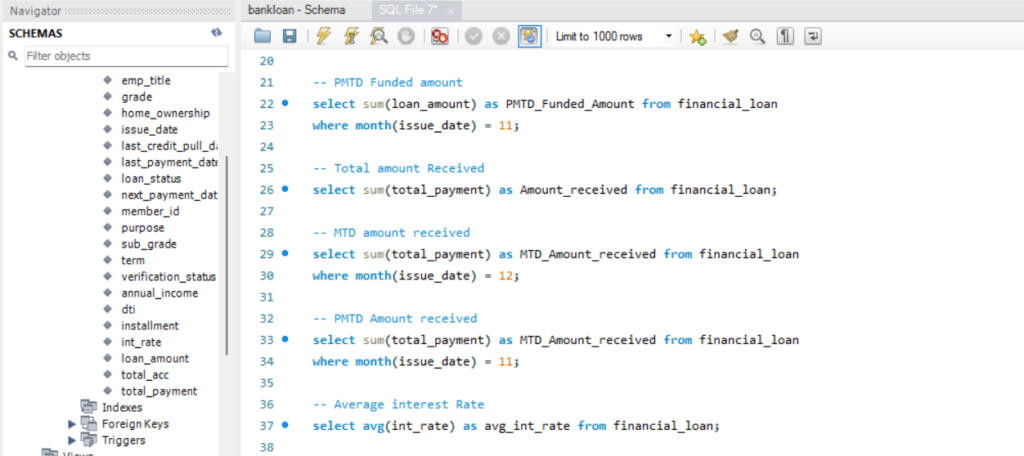
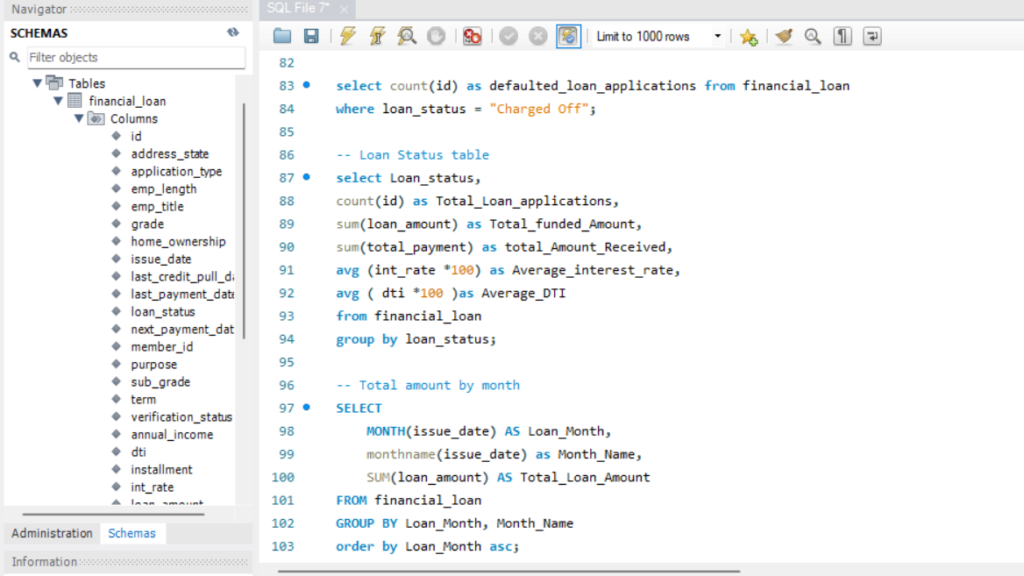
The comprehensive overview of the loan portfolio indicates a substantial scale, with a total of 38.58K loan applications, $435.76M funded, and $473.07M received.
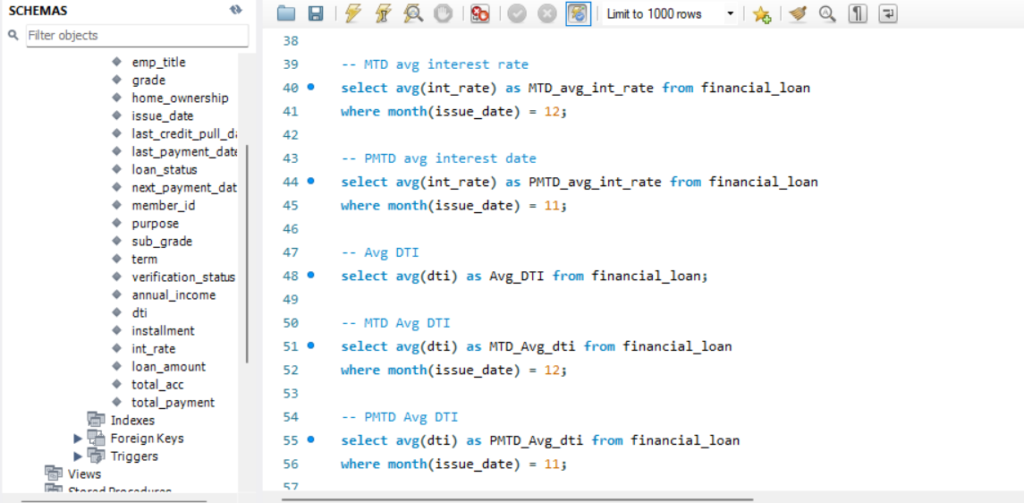
The average interest rate of 12% and average Debt-to-Income Ratio (DTI) of 13% provide key metrics for assessing the overall health and risk profile of the loan portfolio.
Robust Loan Performance:
The consistent growth in Funded Loans, especially during the period from May 2021 to December 2021, indicates a robust and expanding loan portfolio.
Geographic Contribution:
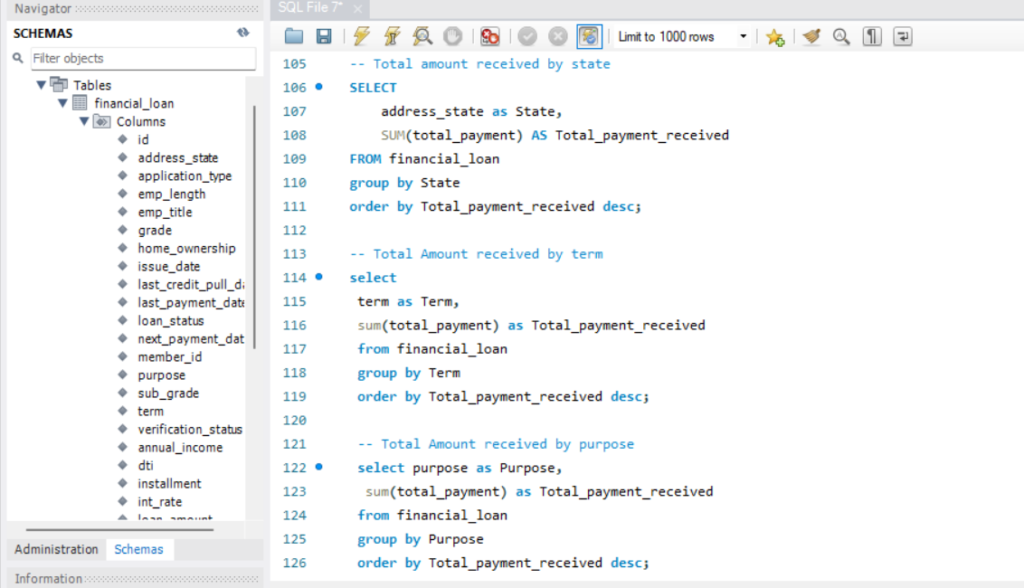
The loan landscape is significantly influenced by states such as California (CA), New York (NY), Texas (TX), Florida (FL), Illinois (IL), and Virginia (VA), emphasizing the importance of these regions in the lending activities.
Term Preferences:
Borrowers exhibit a preference for both 36-month and 60-month loan terms, with the majority (62.3%) opting for a 36-month repayment period.
Common Financial Goal – Debt Consolidation:
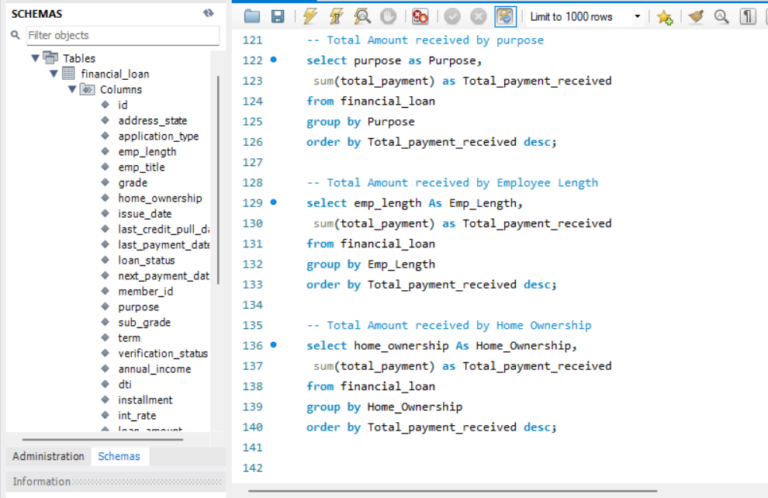
Debt consolidation emerges as the primary reason for loan applications, reflecting a common financial objective among borrowers.
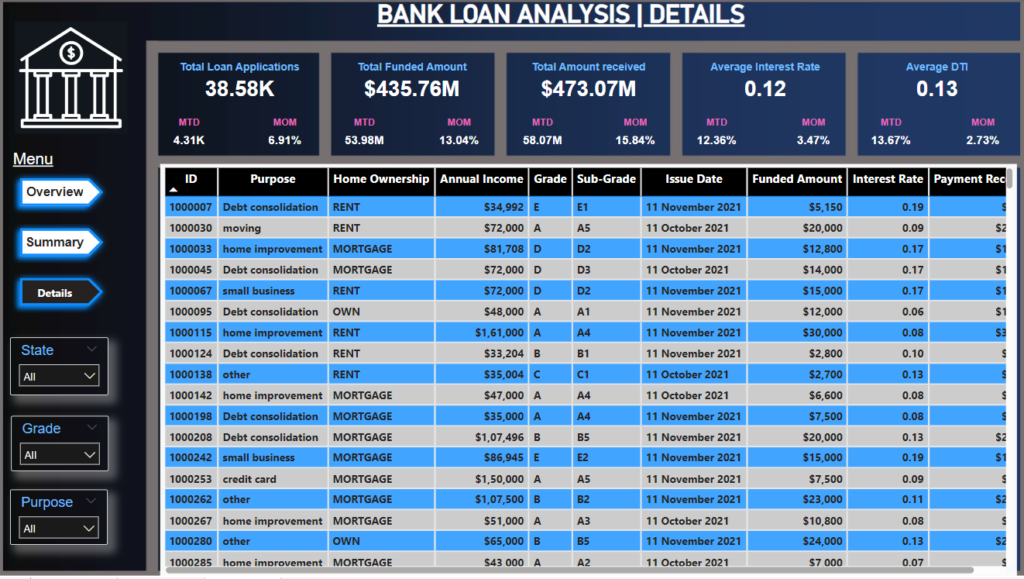
Income and Property Type Influence:
Individuals with more than 10 years of experience contribute significantly to the total received amount, highlighting the impact of income stability on repayment capacity.
Borrowers with mortgage properties demonstrate a higher payment capacity, further influencing the total amount received.
Financial Growth:
The total received amount surpassing the funded amount suggests healthy cash flow and successful repayment patterns, contributing to the financial growth of the lending operations.
Summary Dashboard
Portfolio Composition:
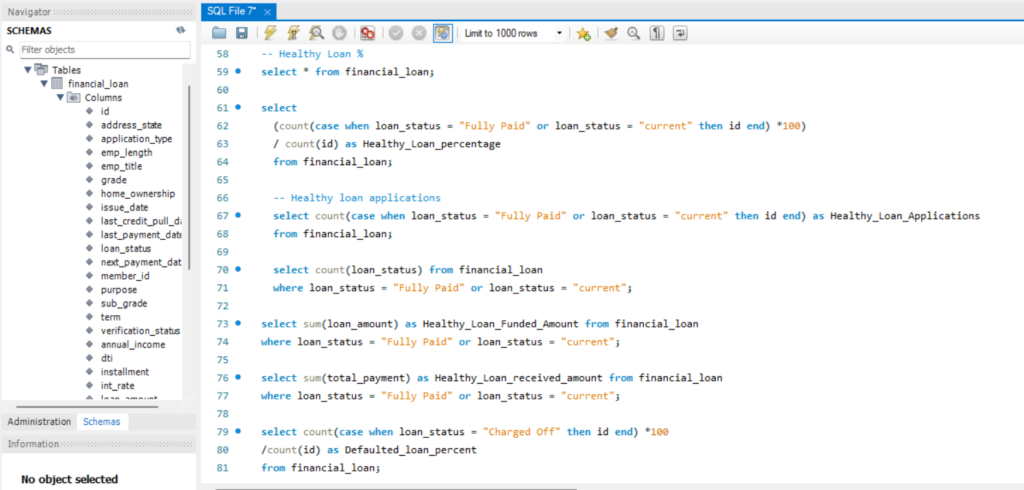
The majority of the loan portfolio, comprising 86.18%, is deemed healthy, demonstrating a generally positive credit profile for the borrower base. This is a strong indicator of the overall financial health of the lending operations.
Healthy Loan Metrics:
Applications: The presence of 33.24K healthy loan applications signifies a robust demand for loans with sound creditworthiness. This indicates that a substantial number of borrowers are seeking financing with favorable credit standings.
Funded Amount: The funded amount of $370.22M for healthy loans reflects the bank’s commitment to supporting financially stable borrowers with significant financial resources.
Received Amount: Healthy loans have successfully attracted $435.79M in total, showcasing a positive trend in repayments and cash flow. Borrowers in this category are actively meeting their repayment obligations.
Defaulted Loan Challenges:
Applications: There are 5.33K loan applications categorized as defaulted, highlighting a segment of the portfolio facing challenges in repayment. Understanding the reasons behind default is crucial for risk management.
Funded Amount: The funded amount of $65.53M in defaulted loans represents the financial exposure associated with loans facing repayment difficulties. This figure informs strategic decisions related to risk mitigation and recovery.
Received Amount: The total received amount of $37.28M for defaulted loans indicates challenges in repayment. Analyzing this data can provide insights into the effectiveness of default management strategies and areas for improvement.
Risk Assessment and Mitigation:
The proportion of defaulted loans (13.82%) underscores the importance of ongoing risk assessment and proactive mitigation strategies. Identifying trends, such as common characteristics among defaulted loans, can inform future lending practices and risk management.
Performance Metrics:
Monitoring metrics such as the percentage of healthy loans versus defaulted loans provides a dynamic view of the portfolio’s performance over time. Identifying shifts in these percentages can prompt timely adjustments to lending strategies.
Opportunities for Improvement:
Examining the defaulted loans can reveal opportunities for improvement in underwriting processes, risk assessment models, and customer engagement strategies. Addressing the challenges within the defaulted segment can contribute to an overall healthier loan portfolio.